Monitoring and Analytics:
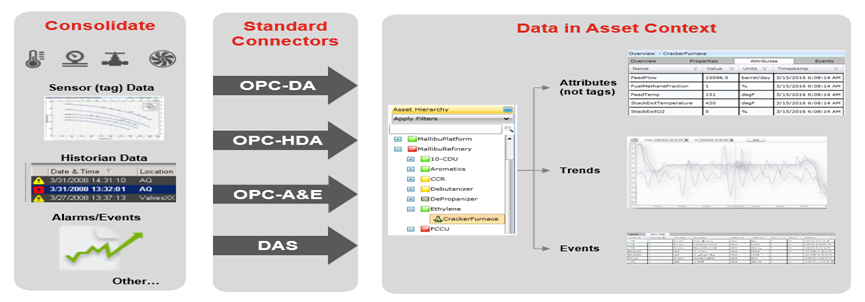
Industrial process and data historians are a proven technology, used for collecting process data and production data from plant floor equipment and control system.
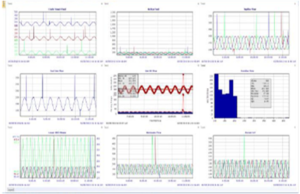 This data is a “time series data” and can be displayed in a trend and seen as changing over time. It can be processed to draw inferences and take appropriate actions.
This data is very useful to different functions to have operational, engineering and business in-site of the plant operations for analytics and take appropriate decisions.
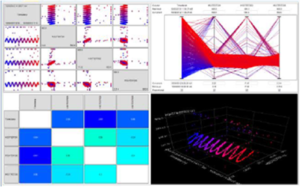 This data is very useful to different functions to have operational, engineering and business in-site of the plant operations for analytics and take appropriate decisions. Changing business environment and business complexities means large data getting generated at different locations. IIOT operations create a unique requirement of data being accessed from multiple locations and over different devises with their own operating systems (windows / iOS, android, etc)
Key Considerations:
The key considerations are :
1) Optimum control network loading
Security of control network
2) Appropriate protocols like OPC / ODBC, etc.
3) Fast and easy access of data
4) Central integration / cloud deployment
5) Creating decision support system.
Our Consultants will help you in :
 1) Consulting for selecting appropriate historian
2) Creating software and system architecture, system sizing, etc. for single / multiple site and enterprise wide installation and deployment.
3) Debugging existing installations and recommending changes.
4) Turnkey installation
Visualization and Dashboards:
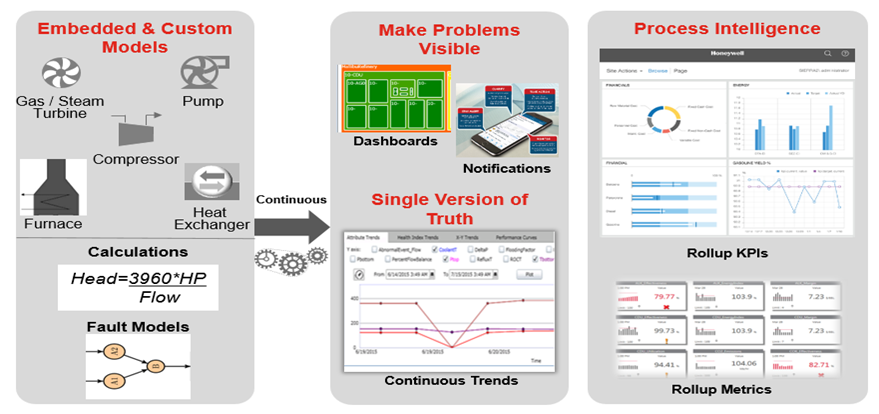
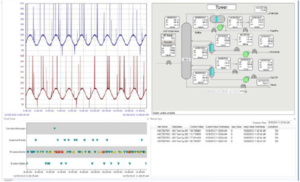 Appropriate calculation and precise presentation and right format of presentation are critical in turning “data” into “knowledge”. This calculated data can be useful for decision support systems.
Visualization & Dashboards provide necessary functionality of creating meaningful data out of all the process and operations data collected in a historian. Different techniques like long term trends, 2D / 3D representation, tag contextualization, HMI type representation etc. are normally used in creating different dashboards.
Dashboards can be created in different technologies and can access data from different sources in a secure and robust way.
Our team of experienced consultants can help you in :
1) Conceptualizing dashboards for different functions (operations / maintenance / etc.)
2) Consulting on technology selection.
3) Turnkey implementation.
A typical example is – Energy dashboards :
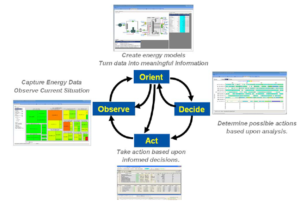 Profitability and efficiency go hand in hand. One of the way to track energy usage in a typical plant is to create energy dashboards. Energy dashboards are a convenient and simple way of monitoring energy usage in different matrix form – like total energy consumption per day, specific energy consumption, on target / off target, etc.
 The key features of this type of dashboards are :
1) Integrated monitoring and decision making suite
2) Data access across different systems / instruments / control systems to create key energy indicators (KEI)
3) Analytical tools to develop energy target models
4) Energy visualization and reporting in different formats like heat maps / KEI / planned target v/s actuals, etc.
Alarm monitoring and analytics
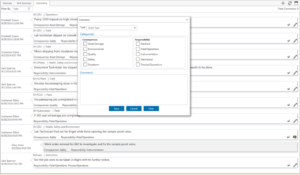
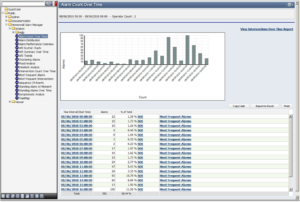 Management of quantity and priority of alarms has become a key challenge in the process industry.
Modern day control systems have made it very easy to configure a low (L) – low low (LL) & High (H) – High High (HH) alarm. The result is that, almost every configured tag has 2 to 4 alarms configured for it.
This results into upsurge, flooding of alarms. Operators get to see 1000’s of alarms in an hour, and the only action that is taken is “acknowledge” or don’t bother.
Add to that the changed alarm limits over a period of time, which may lead to operations in undesired zones.
This can lead to a serious safety situation – where an important alarm, that needs an urgent action, may get missed.
Hence, it is very important that alarms are rationalized and the rate of alarms should be such that a normal “operator” should be able to handle them.
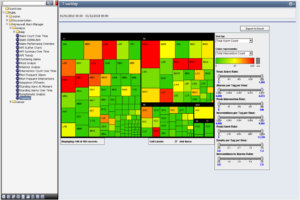 Alarms after rationalization should be close to prescribed figures as per EEMUA or ANSI / ISA standards.Having an effective alarm monitoring and management system is a step towards safety.
Alarm management system also is a key to reduce Industrial insurance premiums as having one is considered as a step towards safe operations.
An effective alarm management system should have the following functionality :
1) Inbuilt EEMUA / ISA standards for comparison.
2) Different dashboards for monitoring and analytics
3) Enforcement and management of change for returning to design limits.
4) Alerts to operators / supervisors for important upsets / actions.
Our experienced consultants can help you in :
1) Conceptualization
2) Consulting
3) Turnkey implementation
4) Alarm rationalization workshops.
Operations monitoring, analytics
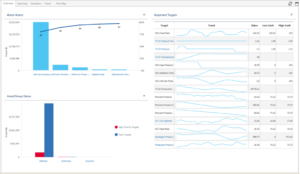 It is desired to keep the operations of a plant into the desired operating limits. These limits could be defined as safety, operational, design limits, etc.
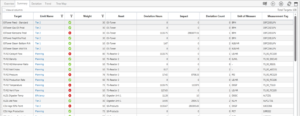
An effective operations monitoring system monitors a process and reports deviations. It also captures actions to be performed by different functions like electrical, instrumentation, maintenance, etc.
Deviations should be linked with profit or loss and should enable operations to take appropriate actions.
 Our team of experienced consultants shall help you in
1) Conceptualization
2) Consulting
3) Turnkey implementation
4) Alarm rationalization workshops.
e-logbooks
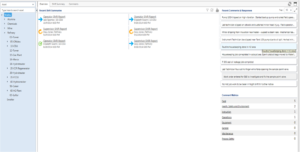 E-logbook is an electronic utility that captures plant data from the control system or the historian or any other data source. It eliminates the need to maintain manual registers. Approval cycles can be configured as required and the data is archived.
The data is available in electronic format and can be used to capture knowledge over a long period of time. This is more of a plug and play type of installation and can be deployed fast.
Asset performance monitoring :
Assets in a typical industry can be divided into plants, individual process units, and individual equipment & instrument. It is critical that all these components should perform as per the design. Performance of different assets can be done at site or over remote devises like windows / iOS / android devises.
The typical steps in this process are:
A) Identify assets to be monitored
B) Implement data acquisition systems
C) Sort and Contextualize data to make meaning out of it
D) Use standard or custom performance models monitoring
E) Compare with standard benchmarks.
